The p5.js canvas works like a piece of graph paper. When you want to draw something, you specify its coordinates on the graph. For example, we can draw a 100x100 pixel rectangle at the point (60, 60).
function setup() {
	createCanvas(400, 400);
	fill(0);
}

function draw() {
	background(240);
	drawGrid();
	fill(0);
	rect(60, 60, 100, 100);
}

function drawGrid() {
	stroke(200);
	fill(120);
	for (var x=-width; x < width; x+=40) {
		line(x, -height, x, height);
		text(x, x+1, 12);
	}
	for (var y=-height; y < height; y+=40) {
		line(-width, y, width, y);
		text(y, 1, y+12);
	}
}
If you want to move your rectangle 120 pixels to the right and 120 pixels down, you can add that to the x and y-coordinates of the rectangle and run rect(180, 180, 100, 100). But there is another way to do this: move the graph paper itself. If you move the graph paper 120 pixels right and 120 pixels down, you will get exactly the same visual result. Moving the coordinate system is called translation, and can be done using the translate() function.
function setup() {
	createCanvas(400, 400);
	fill(0);
}

function draw() {
	background(240);
	translate(120, 120);
	drawGrid();
	fill(0);
	rect(60, 60, 100, 100);
}

function drawGrid() {
	stroke(200);
	fill(120);
	for (var x=-width; x < width; x+=40) {
		line(x, -height, x, height);
		text(x, x+1, 12);
	}
	for (var y=-height; y < height; y+=40) {
		line(-width, y, width, y);
		text(y, 1, y+12);
	}
}
As far as the rectangle is concerned, it hasn't moved at all. Its upper left corner is still at (60, 60). When you use transformations, the things you draw never change position; the coordinate system itself does. We will see how this can be useful in the next section.
Sometimes, a sketch will involve multiple translations to draw the same thing in different locations. If we want to draw the same rectangle in three separate locations -- say at (50, 50), (250, 150), and (140, 280) -- we can use push() and pop() to keep track of and revert our translations as we go. The function pop() undoes all translations made following the previous push(). push() and pop() also track and revert style and color changes -- fill(), stroke(), etc -- in the same way. Thus all translations and style/color commands made between a single push() and pop() apply only to the operations made between them. Take a look at the following example.
function setup() {
	createCanvas(400, 400);
}

function draw() {
	background(240);

	push();
  	translate(50, 50);
	fill(255, 0, 0);
  	rect(0, 0, 100, 100);
	pop();

	push();
  	translate(250, 150);
	fill(0, 255, 0);
  	rect(0, 0, 100, 100);
	pop();

	push();
  	translate(140, 280);
	fill(0, 0, 255);
  	rect(0, 0, 100, 100);
	pop();
}
The first triangle in red is drawn at (0, 0) after the coordinate system has been translated to the right and down by 50 pixels each. After the first pop() is called, the first translation is undone and the coordinate (0, 0) reverts back to the top-left corner of the canvas. We call push() and translate(250, 150), now moving the the canvas 250 pixels right and 150 pixels done, and then draw the green rectangle. The second pop() undoes that translation as well. Finally, the blue triangle is done after making the same operation, this time translating 140 pixels right and 280 pixels down.
In the last sketch, we could have achieved the same visual output by simply drawing the rectangles at those exact points. Or we could have used translate() without the push() and pop() blocks by undoing each translation manually, e.g. translate(-50, -50) to undo the first translation of (50, 50).
For simple shapes like rectangles, it is easier to not use translations, but rather to specify the points manually. But when we begin to draw more complex shapes, translations become advantageous. Let's take a look at an example where translate(), push(), and pop() are really useful.
function setup(){
	createCanvas(400, 400);
}

function draw(){
	background(240);
	for (var x = 5; x < 400; x = x+50){
		for (var y = 5; y < 400; y = y+50){
			push();
			translate(x, y);
	  		drawHouse();
			pop();
		}
	}
}

function drawHouse() {
	triangle(15, 0, 0, 15, 30, 15);
	rect(0, 15, 30, 25);
	rect(12, 30, 10, 10);
}
In this example, we draw a grid of houses. Instead of having to keep track of the coordinates for every vertex of every house, we simply have one function, drawHouse() which draws a house relative to the point (0, 0). We then create a loop which will translate to the correct point before drawing each house.
Using the transformations command allows us to use a single drawing function irrespective of where we intend to draw it on the canvas, while push() and pop() allow us to reserve transformations only to the relevant code blocks.
In addition to translating the grid, you can also rotate it with the rotate() function. This function takes one argument, the angle of rotation. It then rotates the canvas around the origin point (0, 0). It's as though you have a piece of graph paper, place your finger on the point (0, 0), and then rotate the paper around your finger.
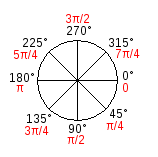
Angle is measured clockwise with zero being at 3 o'clock. In p5.js, all the functions having to do with angles take radians. A single rotation or a full circle has 360° or 2π radians. Here is a diagram of how p5.js measures angles in degrees (black) and radians (red).
Since most people think in degrees, p5.js has a built-in radians() function which takes a number of degrees as its argument and converts it to radians for you. It also has a degrees() function that converts radians to degrees. Take a look at the following example which rotates the canvas by an angle measurement set by the mouseX position. The red square is drawn before rotation, and the green one after rotation.
function setup(){
	createCanvas(400, 400);
}
function draw() {
	var deg = mouseX;
	var rad = radians(deg);

	background(240);

	// the red rectangle is drawn before the rotation so
	// it will stay in place
	fill(255, 0, 0);
	rect(200, 200, 100, 100);
	line(0, 0, 200, 200);

	fill(0, 255, 0);
	text("rotate "+floor(deg)+" degrees", 200, 50);

	// rotation is done here. all subsequent drawing
	// is done post-rotation
	rotate(rad);

	// draw the grid
	drawGrid();

	// the green rectangle and grid is drawn after rotating the canvas
	rect(200, 200, 100, 100);
	line(0, 0, 200, 200);
}

function drawGrid() {
	stroke(200);
    fill(120);
	for (var x=-2*width; x < 2*width; x+=40) {
		line(x, -2*height, x, 2*height);
		text(x, x+1, 12);
	}
	for (var y=-2*height; y < 2*height; y+=40) {
		line(-2*width, y, 2*width, y);
		text(y, 1, y+12);
	}
}
In the last example, the green square goes off the screen as we rotate the canvas more. Sometimes we want to be able to rotate a shape in place, rather than around the top-left corner of the screen. We can do this by combining translate() and rotate() together. Recall that translate() moves the origin (0,0) to another place in the canvas and that rotate() rotates the canvas around the origin. Thus if we want to draw a shape in the middle of the screen and then rotate it in place, we should first translate the canvas to the point we want to draw the shape, then rotate, then draw the shape at (0, 0). Take a look at the following example.
function setup(){
	createCanvas(400, 400);
}
function draw(){
	background(240);

	// move the origin to the pivot point
	translate(150, 150);

	// then rotate the grid around the pivot point by a
	// number of degrees equal to the frame count of the sketch
	rotate(radians(frameCount));

	// and draw the square at the origin
	fill(0);
	rect(0, 0, 100, 100);
}
If you want the rectangle to rotate around its own center point rather than by its corner, we can use the command rectMode(CENTER) to set p5.js to interpret the coordinates of rectangles to refer to the center of the rectangle rather than the top-left corner. The following example is the same as the previous one but with centered coordinates.
function setup(){
	createCanvas(400, 400);
	rectMode(CENTER);	// now the first two arguments of a rect are its center point, not corner
}
function draw(){
	background(240);

	// move the origin to the pivot point
	translate(150, 150);

	// then rotate the grid around the pivot point by a
	// number of degrees equal to the frame count of the sketch
	rotate(radians(frameCount));

	// and draw the square at the origin
	fill(0);
	rect(0, 0, 100, 100);
}
Here is a program that generates a wheel of colors by using rotation, and draws a strip every 25 frames.
function setup() {
	createCanvas(400, 400);
	background(240);
	rectMode(CENTER);
}

function draw(){
	// the modulo operator % calculates the remainder.
	// example: 24 % 25 = 24, 25 % 25 = 0, 26 % 25 = 1, etc.
	// thus this if statement will evaluate True every 25 frames.
	if (frameCount % 25 == 0) {
		fill(random(255), random(255), random(255));
		push();
		translate(200, 200);
		rotate(radians(frameCount));
		rect(0, 0, 300, 20);
		pop();
	}
}
Let's take a look at a more complicated example where we can use translate and rotate together to create interesting symmetries around the center of the canvas. Let's first build it by drawing 8 squares which are evenly distributed along a circle around the center of the canvas. What we do is we first translate to the center of the screen, translating the canvas by (width/2, height/2). We then rotate the canvas to the 8 angles evenly distributed between 0 and 2π radians. We then draw a circle 120 pixels away from the center, after each of these rotations.
function setup() {
	createCanvas(400, 400);
	rectMode(CENTER);
}

function draw(){
	background(240);

	translate(width/2, height/2);
	for (var i = 0; i < 8; i++) {
		push();
		rotate(TWO_PI * i / 8);
		rect(120, 0, 20, 20);
		pop();
	}
}
Look at the line rect(120, 0, 20, 20). Recall that you can draw a shape in the same place by translating to it first and then drawing it at (0, 0). So we can do another another translation after we've rotated, to translate along the right-pointing line after it's been rotated. So we can replace the statement rect(120, 0, 20, 20) with the following two: translate(120, 0) and rect(0, 0, 20, 20). By doing so, we bring the pivot point or origin of the canvas to each of the eight rectangles we just drew.
This is convenient because now we can do something even more interesting. Instead of simply drawing a rectangle at each of those points, let's create another loop which will draw six smaller squares evenly distributed around a small circle around each of these new pivot points. See the following.
function setup() {
	createCanvas(400, 400);
	rectMode(CENTER);
}

function draw(){
	background(240);

	translate(width/2, height/2);
	for (var i = 0; i < 8; i++) {
		push();
		rotate(TWO_PI * i / 8);
		translate(120, 0);
		rect(0, 0, 20, 20);
		for (var j = 0; j < 6; j++) {
			push();
			rotate(TWO_PI * j / 6);
			rect(25, 0, 8, 8);
			pop();
		}
		translate()
		pop();
	}
}
Now that we have achieved an interesting geometry, we can embellish this program by making a variable for the first translation amount and for the x-position of the rectangle, and modulating them in interesting ways. In the following example, we'll modulate those two values using Perlin noise. If you haven't used Perlin noise before, take a look at the tutorial on Perlin noise.
function setup() {
	createCanvas(400, 400);
	rectMode(CENTER);
}

function draw(){
	background(240);

	translate(width/2, height/2);
	for (var i = 0; i < 8; i++) {
		push();
		rotate(TWO_PI * i / 8);
		var tx = 200 * noise(0.01*frameCount);
		translate(tx, 0);
		rect(0, 0, 20, 20);
		for (var j = 0; j < 6; j++) {
			push();
			rotate(TWO_PI * j / 6);
			var rx = 60 * noise(0.01*frameCount + 10);
			rect(rx, 0, 8, 8);
			pop();
		}
		translate()
		pop();
	}
}
Now we're getting somewhere! Let's take the previous example and make the following additions to it to make it even more interesting.
function setup() {
	createCanvas(400, 400);
	rectMode(CENTER);
	fill(0, 50);
	stroke(255, 50);
}

function draw(){
	background(240);

	var ang1 = TWO_PI * noise(0.01*frameCount + 10);
	var ang2 = TWO_PI * noise(0.01*frameCount + 20);
	var ang3 = TWO_PI * noise(0.01*frameCount + 30);
	var rx = 60 * noise(0.01*frameCount + 40);
	var tx = 200 * noise(0.01*frameCount + 50);
	var size1 = 200 * noise(0.01*frameCount + 60);
	var size2 = 50 * noise(0.01*frameCount + 60);

	translate(width/2, height/2);
	for (var i = 0; i < 8; i++) {
		push();
		rotate(ang1 + TWO_PI * i / 8);
		translate(tx, 0);
		rect(0, 0, size1, size1);
		for (var j = 0; j < 6; j++) {
			push();
			rotate(ang2 + TWO_PI * j / 6);
			translate(rx, 0);
			rotate(ang3);
			rect(rx, 0, size2, size2);
			pop();
		}
		translate()
		pop();
	}
}
There is one more function which transforms the coordinate system, and that is scale(). Scale changes the size of the grid by multiplying the coordinate system. See the following example.
function setup() {
	createCanvas(400, 400);
}

function draw(){
	background(240);

	var scaleAmount = mouseX / 200;
  	scale(scaleAmount);

	drawGrid();
  	fill(255, 255, 0);
  	rect(20, 20, 50, 50);
}

function drawGrid() {
	fill(0);
	stroke(120);
	for (var x=-width; x < width; x+=40) {
		line(x, -height, x, height);
		text(x, x+1, 12);
	}
	for (var y=-height; y < height; y+=40) {
		line(-width, y, width, y);
		text(y, 1, y+12);
	}
}
The scaling function can be useful for drawing multiple copies of the same thing at different sizes. Let's bring back our house drawing example, and draw three houses of three separate sizes. We first translate to the position of each house and then use scale to multiply the size of the house in-place.
function setup() {
	createCanvas(400, 400);
}

function draw(){
	background(240);

	push();
	translate(50, 100);
	drawHouse();
	pop();

	push();
	translate(150, 100);
	scale(2.0);
	drawHouse();
	pop();

	push();
	translate(250, 100);
	scale(3.0);
	drawHouse();
	pop();
}

function drawHouse() {
	triangle(15, 0, 0, 15, 30, 15);
	rect(0, 15, 30, 25);
	rect(12, 30, 10, 10);
}
The scaling function can take two arguments instead of one, allowing you to scale by a different amount in the x and y directions. See the following example.
Note that order makes a difference. Translating and then scaling is not necessarily going to give you the same result as scaling and then translating. What happens in the following example if you switch the order of the scale and translate? Try for yourself and see.
function setup() {
	createCanvas(400, 400);
}

function draw(){
	background(240);

	translate(width/2, height/2);
	scale(mouseX / 300, mouseY / 300);

	fill(255, 0, 0);
	triangle(0, -100, -100, 100, 100, 100);
}
Interesting visual results can be found by combining translate, rotate, and scale. See the following example. Try changing some of the numbers in the sketch and see how the result is affected.
function setup() {
	createCanvas(400, 400);
}

function draw(){
	background(240);
	fill(0, 10);
	stroke(0, 160);

	translate(width/2, height/2);

	for (var i=0; i < 30; i++) {
		push();
		rotate(i / 5.0);
		scale(i / 8.0);
		triangle(0, -100, -10, 100, 10, 100);
		pop();
	}
}
In this tutorial, we have covered transformations of the coordinate space including translate(), rotate(), scale(), push(), and pop(). You've seen how they can be helpful in keeping track of coordinates when running repetitive drawing routines. Additionally, you can see how just a few lines of code can generate interesting visual results when transformations are applied multiple times iteratively. Mastering these commands will help you greatly scale the complexity of your programs and produce structured and visual compelling sketches.